Welcome to DU! The truly grassroots left-of-center political community where regular people, not algorithms, drive the discussions and set the standards. Join the community: Create a free account Support DU (and get rid of ads!): Become a Star Member Latest Breaking News Editorials & Other Articles General Discussion The DU Lounge All Forums Issue Forums Culture Forums Alliance Forums Region Forums Support Forums Help & Search

progree

(12,542 posts)
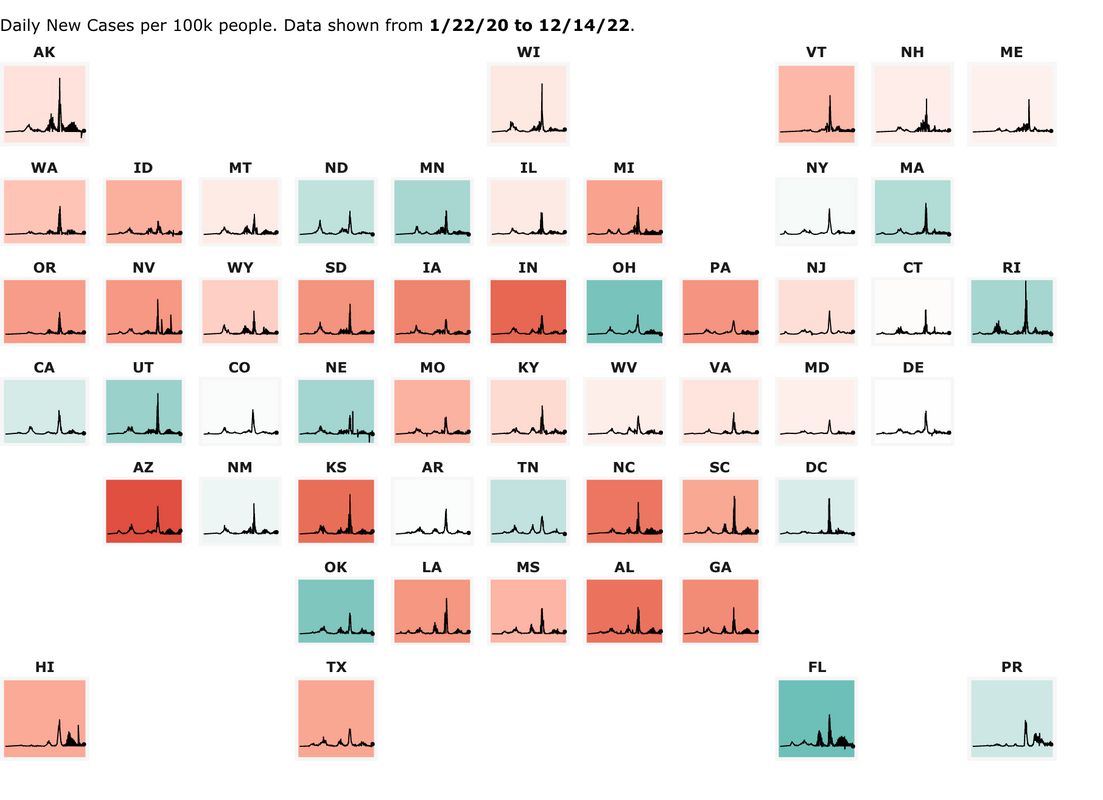
5. The 50 states' minicharts on one page - daily new cases per capita, 7 day moving avg,
Sun Oct 4, 2020, 11:02 PM
Oct 2020

50 states' minicharts "map" page, alternative to the NY Times from John Hopkins University
      The below "map" of the 50 states' minicharts (which are scaled by daily new cases PER CAPITA), is from the John Hopkins U. https://coronavirus.jhu.edu/data/new-cases-50-states -- at that page you can click on individual states on the "map". Showing 3-day moving average of new cases. I prefer the nytimes' charts which are 7 day moving averages)


=######################################=

A lot of idiots out in Las Vegas - Fremont St, Las Vegas earthcam
nothing like Friday and Saturday nights at this time (901 pm Pacific, which is Las Vegas' time zone) but the night is still young. Grab some sliders at the White Castle for me
https://www.earthcam.com/cams/nevada/lasvegas/index.php?cam=catsmeow_lv_fremont

Recommendations

0 members have recommended this reply (displayed in chronological order):

Latest Discussions»Retired Forums»Video & Multimedia»Red States Are Getting Hi...»Reply #5