Economy
Related: About this forumSTOCK MARKET WATCH: Friday, 4 April 2025
STOCK MARKET WATCH: Friday, 4 April 2025
Previous SMW: (Not currently available)
AT THE CLOSING BELL ON 3 April 2025
Dow Jones 40,545.93 -1,679.39 (3.98%)
S&P 500 5,396.52 -274.45 (4.84%)
Nasdaq 16,550.61 -1,050.44 (5.97%)
+++++++++++++++++++++++++++++++++++++++++++++++++++++++++++++++++++++++
Market Conditions During Trading Hours:
Google Finance
MarketWatch
Bloomberg
Stocktwits
(click on links for latest updates)
+++++++++++++++++++++++++++++++++++++++++++++++++++++++++++++++++++++++
Currencies:
(Awaiting new links)
Gold & Silver:
(Awaiting new links)
Petroleum:
+++++++++++++++++++++++++++++++++++++++++++++++++++++++++++++++++++++++
DU Economics Group Contributor Megathreads:
Progree's Economic Statistics (with links!)
mahatmakanejeeves' Rail Safety Megathread
mahatmakanejeeves' Oil Train Safety Megathread
+++++++++++++++++++++++++++++++++++++++++++++++++++++++++++++++++++++++
Quote for the Day:
I told you so.
-- Tansy Gold, and many, many others
This thread contains opinions and observations. Individuals may post their experiences, inferences and opinions on this thread. However, it should not be construed as advice. It is unethical (and probably illegal) for financial recommendations to be given here.
question everything
(51,163 posts)progree
(12,430 posts)Last edited Fri Apr 4, 2025, 01:11 AM - Edit history (2)
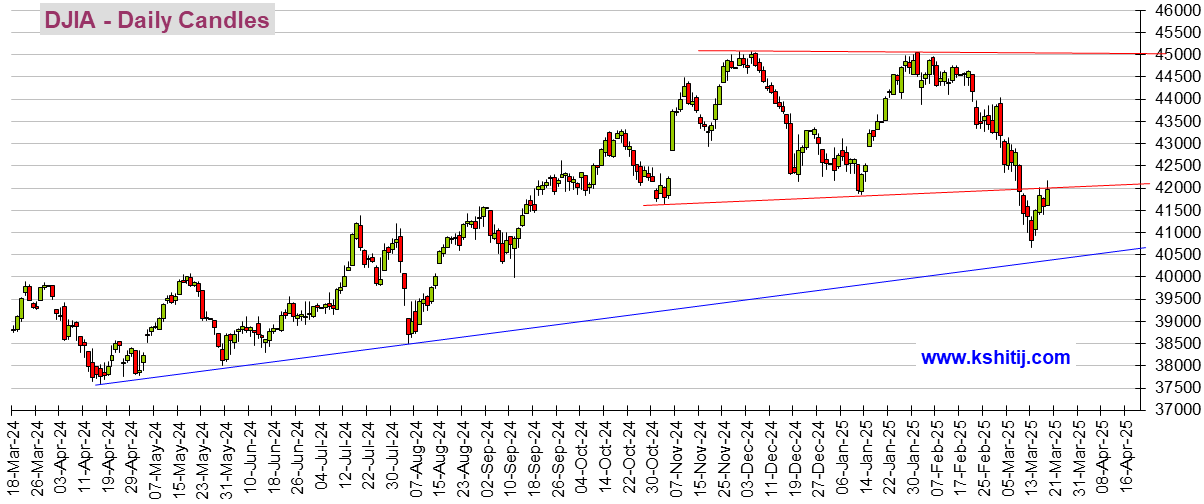
so today's huge plunge to 40,545.93 (1679 points, 3.98%) won't likely show up on the graph until about 10 PM EDT. When it does, it will be about at the same level as the bottom of the valley around March 13 on the graph. So if it doesn't look as bad as one might expect it to look, it soon will.
So far we're not in any new territory as far as stock market performance. We've reached a correction in the S&P 500 (meaning more than 10% down from a recent high) but that happens every 2 years on average. (We're at 12.2% down from the Feb 19 all time high at today's 4/3 close).
"How often do corrections occur?", AP, https://www.democraticunderground.com/111699904
Market Correction: What Does It Mean?, Schwab, 3/14/25
https://www.schwab.com/learn/story/market-correction-what-does-it-mean
 ?imwidth=1920
More details on the S&P 500 (which is far more representative of the total U.S. stock market, and what on average investors own) than the Dow is at https://www.democraticunderground.com/111699775
I update it at the close of every market day (but no promises). It gives the S&P 500 performance at the close of the day compared to various time points like since inauguration day eve, since the election day close, since the all-time high, year-to-date, and the previous day's close.
In spite of today's plunge, and the drop in the S&P 500 since its all time high of February 19, I note that in the past 10.25 years (December 31, 2014 thru 4/3/2025 close) it has gone up more than 3.11 fold. In the last 20.25 years, up more than 6.47 fold. In the last 30.25 years: 20 fold. In the last 40.25 years 76 fold. In the last 50.25 years: 298 fold. In the last 60.25 years: 339 fold. In the last 70.25 years: 1222 fold. So for long-term investors, a 12% drop from the all-time high is a blip. But yes, we've never had a madman with a cabinet and agency heads that are a complete joke. And if he keeps the tariffs on as bad as they are now, or worse escalates them, it's going to get bad.
When it reaches 20% down, I plan to over-allocate to equities beyond my current percentage by shifting some fixed income stuff to equities (via a broad-based fund like the U.S. total market index fund).. And some more at 30% down. This is known as buying stocks on sale.
=================================================
Technical Note - The reason for figuring numbers over the last 10.25 years, the last 20.25 years, etc.,
rather than the last 10 years, the last 20 years, etc. is because my source for the S&P 500 total return performance only has numbers at year end (12/31/yy):
http://pages.stern.nyu.edu/~adamodar/New_Home_Page/datafile/histretSP.html
So for something like today's April 3, which is about 0.25 years into 2025, I essentially just tack it at the end of their table and adjust some text and formulas.
It would be a lot more work for me, when doing these numbers to look up April 3 from some other source for 10 years ago, 20 years ago, and so on. So yeah, "over the last 10.25 years" etc. looks kind of peculiar, but that's why.
Another thing I could have done instead is just change the 12/31/24 value to its April 3 value, and then say, "if the market had closed out 2024 at today's April 3 level, then over the last 10 years it would have gone up blah blah, and over the last 20 years blah blah, etc. but I feel that would seem too artificial for some.
Hugin
(36,964 posts)But, I took the day off.
Had me some me time! I'll remember this day for the rest of my life! It was amazing! I felt like a teenager on top of the world!
![]()
![]()
So much fun!
progree
(12,430 posts)Futures:
https://www.Investing.com
Lots of info here including markets across the world. But some peculiarities about the site, I explain some of them at
https://www.democraticunderground.com/10143432216#post6
Another one: https://www.cnn.com/markets/premarkets
*Update: The Asian markets (actual, not futures) are doing poorly like Nikkei down 3.7%, Australia down 2.5% (Chinese markets are closed) 12:25 AM EDT
At investing.com
on the main panel on the left side, where it says Markets
click on Indices and then
click on Asia/Pacific.
# Update for anyone reading this: S&P 500 and Dow futures both about 2.5% down at 633 AM ET. For Dow, that's about 1000 points down.
# Big jobs report comes out at 830 AM ET (payroll jobs and unemployment rate)
# Markets open at 930 AM ET.
Hugin
(36,964 posts)A video will have to do.
?si=_QaJcZew-VtFshFT
You were warned!
Tansy_Gold
(18,167 posts)how to post photos/pics of any kind to DU any more. I'm not even going to try to learn. If I really want to say "JUMP, YOU FUCKERS!" I can just type it out like that. Easy peasy!
And I see, now that it's Friday morning and the markets are open again, that the rational ![]() exuberance is enjoying a second day.
exuberance is enjoying a second day.
I don't know if I'll resurrect the daily SMW, but we'll see. . . . . At least now it's interesting. ![]()
progree
(12,430 posts)When it does, the big red candle will extend all the way down to 38,315, which is about the same level as the lowest point on the whole graph, roughly meaning a whole year's gain has been wiped out.
I noticed the S&P 500 closed Friday 12.3% below it's election day level. So on average, for every $8 stockholders had when they went to the polls on Nov. 5, they now have $7.
Hugin
(36,964 posts)Only barely, tho.
Now, if the marketeers keep throwing good money after bad. A downward ratcheting will eat it up.
